
A burnup chart is a visual graph widely used in Agile that tracks the total scope of the project vs. the work completed in the project. The work completed ‘burns up’ towards the total scope line. The scope and work are generally represented in story points, associated to user stories that are being delivered over time, so over sprints.

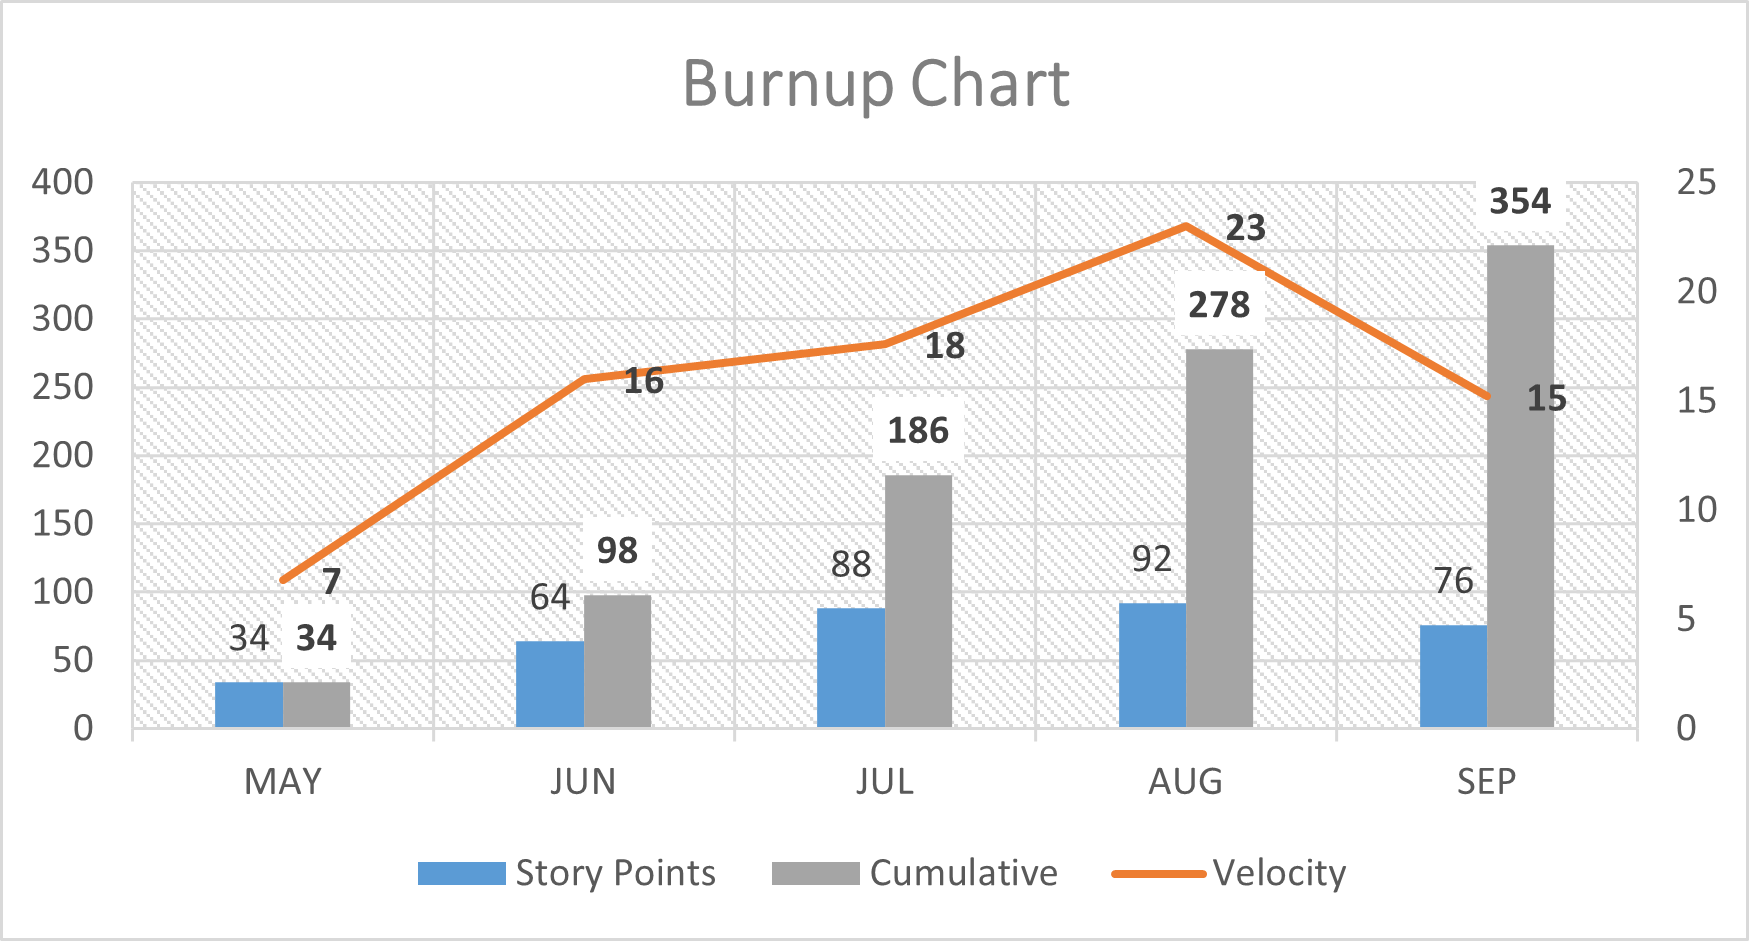
The above is of course, the theoretical and traditional definition of the burnup chart, but in practice you might not actually know what the total scope of the project is or will be. Particularly, in Agile projects. But you can still use the burnup chart in a different form such as the one represented below, to showcase the number of story points delivered over a Sprint, the cumulative story points delivered over time and the team’s velocity. This type of burnup chart will give you a good indication of team performance and will also provide project stakeholders with a visual representation of project progress and the amount of work done over time. It will also help to keep the Agile team motivated by visually representing execution and progress.
A burnup chart is also the inverse of a burndown chart.
Want to learn more about Agile? Read this EBOOK, listen to this AUDIOBOOK or enroll in this COURSE